Gantt Segment View
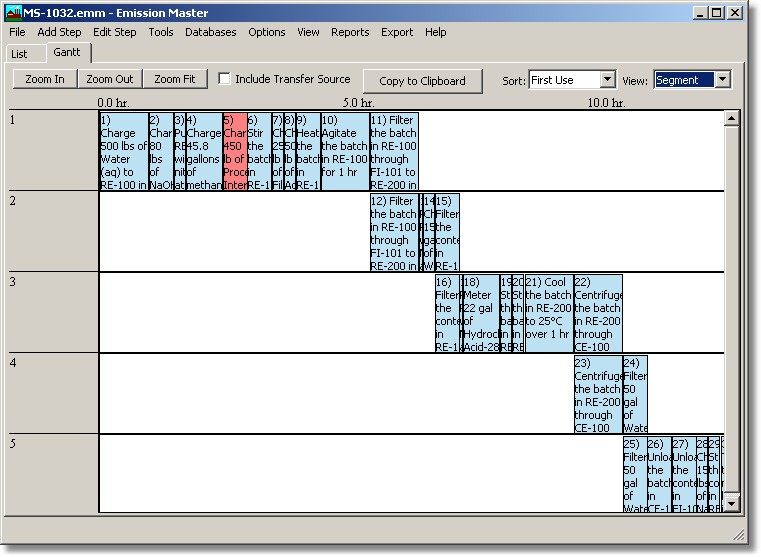
In the Gantt Segment View the process model is shown graphically where each block represents a single process activity. The horizontal axis is in hours and vertical axis is in groups of contiguous activities as they took place within the process. In the Gantt View below process activities are represented by separate blocks where each block represents a single process activity. Process Activity #5 is in focus as shown by the red color. Once a process activity has been placed in focus then it may be edited using the upper Edit Step menu.